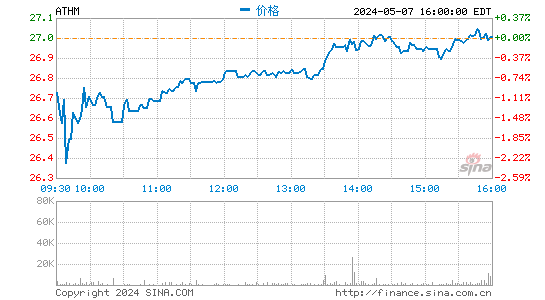
北京时间2017年5月10日,中国领先的汽车互联网服务平台汽车之家(38.99, 1.99, 5.38%)(NYSE:ATHM)发布了截至2017年3月31日未经审计的2017年第一季度财报。
2017年第一季度,汽车之家净营收增长超预期,同比增长23.3%至13.48亿元人民币(1.959亿美元),归属于汽车之家的调整后净利润同比增长24.7%至3.67亿元人民币(5335万美元)。随着AR网上车展、台网互动等创新模式的拓展,汽车之家持续发力数据技术领域、推动技术应用创新。
“我们在2017年取得大好开局,第一季度的业绩表现优于预期,这一方面归功于移动端流量的稳定增长,另一方面也是由于我们一直努力持续赢得更多线上汽车广告、交易市场的份额。这足以反映汽车之家在市场地位、品牌认知度和销售线索服务上的绝对优势。”汽车之家总裁康雁表示,我们将持续前进,包括进一步发展我们的社区,与我们的消费者高效互联互动、覆盖他们买车用车换车的整个周期,以及不断利用大数据和技术手段完善我们的汽车生态圈。
整体市场在一季度向来存在季节性因素的不利影响,但汽车之家仍然在今年第一季度取得了超预期的业绩。今年一季度,作为公司核心业务的媒体业务和销售线索业务取得明显增长,其中,媒体业务净营收同比增长17.2%至5.18亿元人民币,销售线索业务净营收同比增长40.1%至5.38亿元人民币。
汽车之家于2016年10月发布“4+1”战略,建设车媒体、车电商、车金融、车生活四个圈,转型升级为基于数据技术的“汽车”公司,打造汽车生态圈。在新战略引导下,汽车之家持续发力数据技术领域,推动数据技术创新模式的研发和应用。今年3月17日至22日举办的汽车之家3月疯狂购车节中,汽车之家领先业内、首次将增强现实(AR)技术应用在线上车展中,创立AR汽车展厅的新模式,增强了用户的互动性和参与度,为即将举办的6月疯狂购车节奠定了技术基础。此外,今年4月汽车之家与湖南卫视达成战略合作,创新开展台网互动的汽车广告模式,通过摇一摇大屏转小屏,增强消费者的互动和参与、促进销售线索转化。
服务、产品的创新,进一步推动了汽车之家流量的增长。根据财报数据,2017年第一季度,汽车之家移动端网站和移动应用App的日均独立用户访问量分别约为1010万和820万。移动端日均独立用户总访问量同比增长23%。
汽车之家CFO王俊朗表示:“今年第一季度,我们净营收持续增长超出预期,盈利能力也稳健提升。在2017年,我们计划通过我们的核心媒体平台、销售线索业务以及具有‘赋能’作用的交易和服务,继续推动增长和提升盈利能力。”
汽车之家董事长兼CEO陆敏在今年初接受媒体采访时表示:“汽车之家已经从媒体化的1.0时代,走到了以数据技术为核心、平台化的2.0时代。汽车之家将持续探索、研发新技术,创新数据技术应用,为用户、客户赋能。”
2017年第一季度财报要点[1]:
净营收同比增长23.3%至13.484亿元人民币(1.959亿美元)。
归属于汽车之家的净利润同比增长33.8%至3.274亿元人民币(4757万美元)。
经营活动产生的净现金同比增长205.4%至4.952亿元人民币(7195万美元)。
2017年第一季度经营业绩要点:
移动端流量持续增长:2017年第一季度,汽车之家移动端网站和移动应用App的日均独立用户访问量分别约为1,010万和820万。移动端日均独立用户总访问量同比增长23%。本季度汽车之家主APP的日均使用时长为18分钟。
在“三月疯狂购车节”上成功应用增强现实(AR)技术:公司于 2017年3月17日至22日举办了“三月疯狂购车节”。本次购车节中,汽车之家首次引入了先进的AR汽车展厅,增强了用户的互动性和参与度。这次活动的成功举办为计划中的“六月购车节”活动奠定了坚实的基础,届时将有更多的汽车制造商受邀参加AR车展。
轻资产的新车电商平台模式:公司按照计划继续进行电商业务模式调整,打造轻资产新车电商平台。汽车之家在2017年第一季度售出了直营库存中3,658台汽车。
2017年第一季度财报概述
主要财务业绩
|
(单位:百万元人民币,除每股收益数据以外)
|
1Q2016
|
1Q2017
|
% 变动
|
|
净营收
|
1,093.5
|
1,348.4
|
23.3%
|
|
归属于汽车之家的净利润
|
244.7
|
327.4
|
33.8%
|
|
归属于汽车之家的调整后净利润[2]
|
294.4
|
367.2
|
24.7%
|
|
每股摊薄收益[3]
|
2.11
|
2.80
|
32.7%
|
|
经营活动产生的净现金
|
162.2
|
495.2
|
205.4%
|
业务展望
汽车之家目前预计,2017年第二季度净营收为14.05亿元人民币(2.041亿美元)至14.37亿元人民币(2.088亿美元),同比增长1.9%至4.3%。
这一预期反映了汽车之家目前对市场和运营状况的初步看法,未来有可能调整。
|
AUTOHOME INC.
|
|
CONSOLIDATED STATEMENTS OF COMPREHENSIVE INCOME
|
|
(Amount in thousands, except per share data)
|
|
|
|
|
|
|
|
|
|
|
|
For three months ended March 31,
|
|
|
|
2016
|
|
2017
|
|
|
|
RMB
|
|
RMB
|
|
US$
|
|
|
|
(Unaudited)
|
|
(Unaudited)
|
|
(Unaudited)
|
|
|
Net revenues:
|
|
|
|
|
|
|
|
Media services
|
442,130
|
|
518,072
|
|
75,266
|
|
|
Leads generation services
|
384,054
|
|
537,987
|
|
78,159
|
|
|
Online marketplace
|
267,277
|
|
292,302
|
|
42,466
|
|
|
Total net revenues
|
1,093,461
|
|
1,348,361
|
|
195,891
|
|
|
|
|
|
|
|
|
|
|
Cost of revenues
|
(383,390)
|
|
(444,593)
|
|
(64,591)
|
|
|
Gross profit
|
710,071
|
|
903,768
|
|
131,300
|
|
|
|
|
|
|
|
|
|
|
Operating expenses:
|
|
|
|
|
|
|
|
Sales and marketing expenses
|
(329,127)
|
|
(306,328)
|
|
(44,504)
|
|
|
General and administrative expenses
|
(72,017)
|
|
(60,381)
|
|
(8,772)
|
|
|
Product development expenses
|
(115,490)
|
|
(189,726)
|
|
(27,564)
|
|
|
Operating profit
|
193,437
|
|
347,333
|
|
50,460
|
|
|
|
|
|
|
|
|
|
|
Interest income
|
18,824
|
|
38,890
|
|
5,650
|
|
|
Loss from equity method investments
|
(1,629)
|
|
(2,619)
|
|
(380)
|
|
|
Other income, net
|
936
|
|
10,116
|
|
1,470
|
|
|
Income before income taxes
|
211,568
|
|
393,720
|
|
57,200
|
|
|
|
|
|
|
|
|
|
|
Income tax (expense)/benefit
|
33,083
|
|
(68,785)
|
|
(9,993)
|
|
|
Net income
|
244,651
|
|
324,935
|
|
47,207
|
|
|
Net loss attributable to noncontrolling interests
|
-
|
|
2,482
|
|
361
|
|
|
Net income attributable to Autohome Inc.
|
244,651
|
|
327,417
|
|
47,568
|
|
|
Earnings per share for ordinary shares
|
|
|
|
|
|
|
|
Basic
|
2.16
|
|
2.83
|
|
0.41
|
|
|
Diluted
|
2.11
|
|
2.80
|
|
0.41
|
|
|
|
|
|
|
|
|
|
|
Weighted average shares used to compute earnings per share attributable to Class A and Class B common stockholders:
|
|
|
|
|
|
|
|
|
|
|
|
|
|
|
Basic
|
113,321,719
|
|
115,578,134
|
|
115,578,134
|
|
|
Diluted
|
115,689,256
|
|
117,132,322
|
|
117,132,322
|
|
|
|
|
|
|
|
|
|
|
Other comprehensive income attributable to Autohome Inc., net of tax of nil
|
|
|
|
|
|
|
|
Foreign currency translation adjustments
|
(4,843)
|
|
(5,488)
|
|
(797)
|
|
|
Comprehensive income attributable to Autohome Inc.
|
239,808
|
|
321,929
|
|
46,771
|
|
|
|
|
|
|
|
|
|
|
|
|
|
|
|
|
|
|
|
|
|
|
|
|
|
|
|
|
|
AUTOHOME INC.
|
|
RECONCILIATION OF NON-GAAP AND GAAP RESULTS
|
|
(Amount in thousands, except per share data)
|
|
|
For three months ended March 31,
|
|
|
|
|
2016
|
|
2017
|
|
|
|
|
RMB
|
|
RMB
|
|
US$
|
|
|
|
|
(Unaudited)
|
|
(Unaudited)
|
|
(Unaudited)
|
|
|
|
|
|
|
|
|
|
|
|
|
Net incomeattributable to Autohome Inc.
|
244,651
|
|
327,417
|
|
47,568
|
|
|
|
Plus: income tax expense/(benefit)
|
(33,083)
|
|
68,785
|
|
9,993
|
|
|
|
Plus: depreciation of property and equipment
|
15,361
|
|
19,616
|
|
2,850
|
|
|
|
Plus: amortization of intangible assets
|
1,138
|
|
1,145
|
|
166
|
|
|
|
EBITDA
|
228,067
|
|
416,963
|
|
60,577
|
|
|
|
Plus: share-based compensation
expenses
|
48,629
|
|
38,653
|
|
5,616
|
|
|
|
|
Adjusted EBITDA
|
276,696
|
|
455,616
|
|
66,193
|
|
|
|
|
|
|
|
|
|
|
|
|
Net incomeattributable to Autohome Inc.
|
244,651
|
|
327,417
|
|
47,568
|
|
|
|
Plus: amortization of acquired intangible assets of Cheerbright,
China Topside and Norstar
|
1,138
|
|
1,138
|
|
165
|
|
|
|
|
Plus: share-based compensation expenses
|
48,629
|
|
38,653
|
|
5,616
|
|
|
|
Adjusted Net Income attributable to Autohome Inc.
|
294,418
|
|
367,208
|
|
53,349
|
|
|
|
|
|
|
|
|
|
|
|
|
Non-GAAP Earnings per share for
ordinary shares
|
|
|
|
|
|
|
|
Basic
|
2.60
|
|
3.18
|
|
0.46
|
|
|
|
Diluted
|
2.54
|
|
3.13
|
|
0.45
|
|
|
|
|
|
|
|
|
|
|
|
|
Weighted average shares used to compute earnings per share attributable to Class A and Class B common stockholders:
|
|
|
|
|
|
|
|
|
|
|
|
|
|
|
|
|
|
Basic
|
113,321,719
|
|
115,578,134
|
|
115,578,134
|
|
|
|
Diluted
|
115,689,256
|
|
117,132,322
|
|
117,132,322
|
|
|
|
|
|
|
|
|
|
|
|
|
|
|
|
|
|
|
|
|
|
|
|
AUTOHOME INC.
|
|
|
CONDENSED CONSOLIDATED BALANCE SHEETS
|
|
|
(Amount in thousands, except as noted)
|
|
|
|
|
As of December31,
|
|
As of March 31,
|
|
|
|
|
2016
|
|
2017
|
|
|
|
|
RMB
|
|
RMB
|
|
US$
|
|
|
|
|
(Audited)
|
|
(Unaudited)
|
|
(Unaudited)
|
|
ASSETS
|
|
|
|
|
|
|
|
|
Current assets:
|
|
|
|
|
|
|
|
|
Cash and cash equivalents
|
|
3,293,911
|
|
1,594,285
|
|
231,620
|
|
|
Restricted cash
|
|
9,319
|
|
-
|
|
-
|
|
|
Short-term investments
|
|
2,430,091
|
|
4,595,573
|
|
667,651
|
|
|
Accounts receivable, net
|
|
1,205,924
|
|
1,069,565
|
|
155,388
|
|
|
Inventories, net
|
|
95,617
|
|
32,880
|
|
4,777
|
|
|
Amounts due from related parties, current
|
|
20,451
|
|
12,046
|
|
1,750
|
|
|
Prepaid expenses and other current assets
|
|
377,219
|
|
329,498
|
|
47,870
|
|
|
Total current assets
|
|
7,432,532
|
|
7,633,847
|
|
1,109,056
|
|
|
Non-current assets:
|
|
|
|
|
|
|
|
|
Property and equipment, net
|
|
134,574
|
|
146,889
|
|
21,340
|
|
|
Goodwill and intangible assets, net
|
|
1,533,945
|
|
1,532,801
|
|
222,687
|
|
|
Long-term investments
|
|
134,466
|
|
131,848
|
|
19,155
|
|
|
Deferred tax assets, non-current
|
|
121,663
|
|
130,099
|
|
18,901
|
|
|
Other non-current assets
|
|
34,846
|
|
44,122
|
|
6,410
|
|
|
Total non-current assets
|
|
1,959,494
|
|
1,985,759
|
|
288,493
|
|
|
Total assets
|
|
9,392,026
|
|
9,619,606
|
|
1,397,549
|
|
|
|
|
|
|
|
|
|
|
|
LIABILITIES AND EQUITY
|
|
|
|
|
|
|
|
Current liabilities:
|
|
|
|
|
|
|
|
|
Accrued expenses and other payables
|
1,151,547
|
|
1,004,946
|
|
146,001
|
|
|
Advance from customers
|
|
75,882
|
|
45,962
|
|
6,677
|
|
|
Deferred revenue
|
|
1,012,143
|
|
1,085,589
|
|
157,716
|
|
|
Notes payable
|
|
31,063
|
|
-
|
|
-
|
|
|
Income tax payable
|
|
256,775
|
|
287,065
|
|
41,705
|
|
|
Amounts due to related parties
|
|
16,630
|
|
17,899
|
|
2,600
|
|
|
Total current liabilities
|
|
2,544,040
|
|
2,441,461
|
|
354,699
|
|
|
Non-current liabilities:
|
|
|
|
|
|
|
|
|
Other liabilities
|
|
34,977
|
|
34,977
|
|
5,082
|
|
|
Deferred tax liabilities
|
|
461,796
|
|
429,259
|
|
62,363
|
|
|
Total non-current liabilities
|
|
496,773
|
|
464,236
|
|
67,445
|
|
|
Total liabilities
|
|
3,040,813
|
|
2,905,697
|
|
422,144
|
|
|
|
|
|
|
|
|
|
|
|
Equity:
|
|
|
|
|
|
|
|
|
Total Autohome Inc. Shareholders’ equity
|
|
6,360,404
|
|
6,725,582
|
|
977,101
|
|
|
Noncontrolling interests
|
|
(9,191)
|
|
(11,673)
|
|
(1,696)
|
|
|
Total equity
|
|
6,351,213
|
|
6,713,909
|
|
975,405
|
|
|
Total liabilities and equity
|
9,392,026
|
|
9,619,606
|
|
1,397,549
|
|
|
|
|
|
|
|
|
|
|
|
|
|
[1]公司编制财报所采用的货币为人民币。为方便阅读,新闻稿中提供了部分美元折算数据。除非特别注明,所有人民币和美元的折算基础为2017年3月31日纽约美国联邦储备银行海关电汇买入牌价,即1美元=6.8832元人民币。不代表人民币过去可能或者未来可能以此汇率结算。
[2]归属于汽车之家的调整后净利润不包括股权激励费用和与收购相关的无形资产摊销费用。有关此定义和其它非美国通用会计准则财务处理的信息,详见英文版业绩公告新闻稿“非美国会计准则财务处理的应用 ”部分以及新闻稿最后标题为“非美国通用会计准则和美国通用会计准则下财务数据调整”的表格。
[3]1股普通股等同于1股美国存托股(ADS)。